Cost Reports
Cost Reports are multi-dimensional reports for finding and tracking costs. How to use Cost Reports is covered in the Vantage documentation. This page will focus on a compendium of specific types of reports that are helpful for controlling cloud costs.
Report Examples#
These use cases have come up repeatedly in the cloud costs community. Contributors are encouraged to add more as they see fit.
Untagged Resources#

Many organizations use tags to keep track of all their cloud resources. For practitioners, keeping the percentage of untagged resources low means greater visibility inside cost tools. Tags must be enabled to be used in Cost Reports.
Showback Report#

Shared resources like support or a database cluster make divvying up costs among teams difficult. Use the Cost Allocation tool to create a Showback or Chargeback report for transparent reporting.
Compute Costs without Data#
Very active data teams generate costs as well as insights. For measuring just the cost to deliver software, exclude these costs from a report.
Just Data Egress#
Data egress is famously the third cost category of AWS that is very significant for teams, alongside compute and storage. Using subcategories, it is possible to see data egress costs per service.
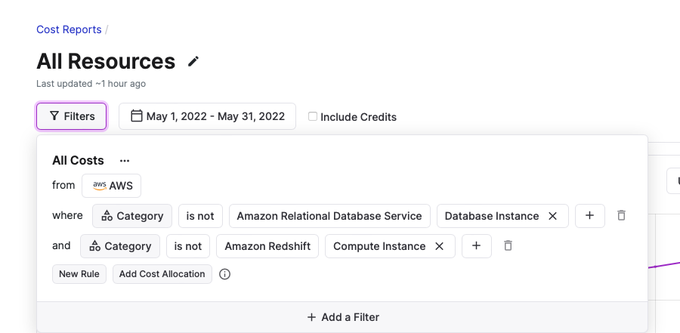
Redshift Instance Costs#
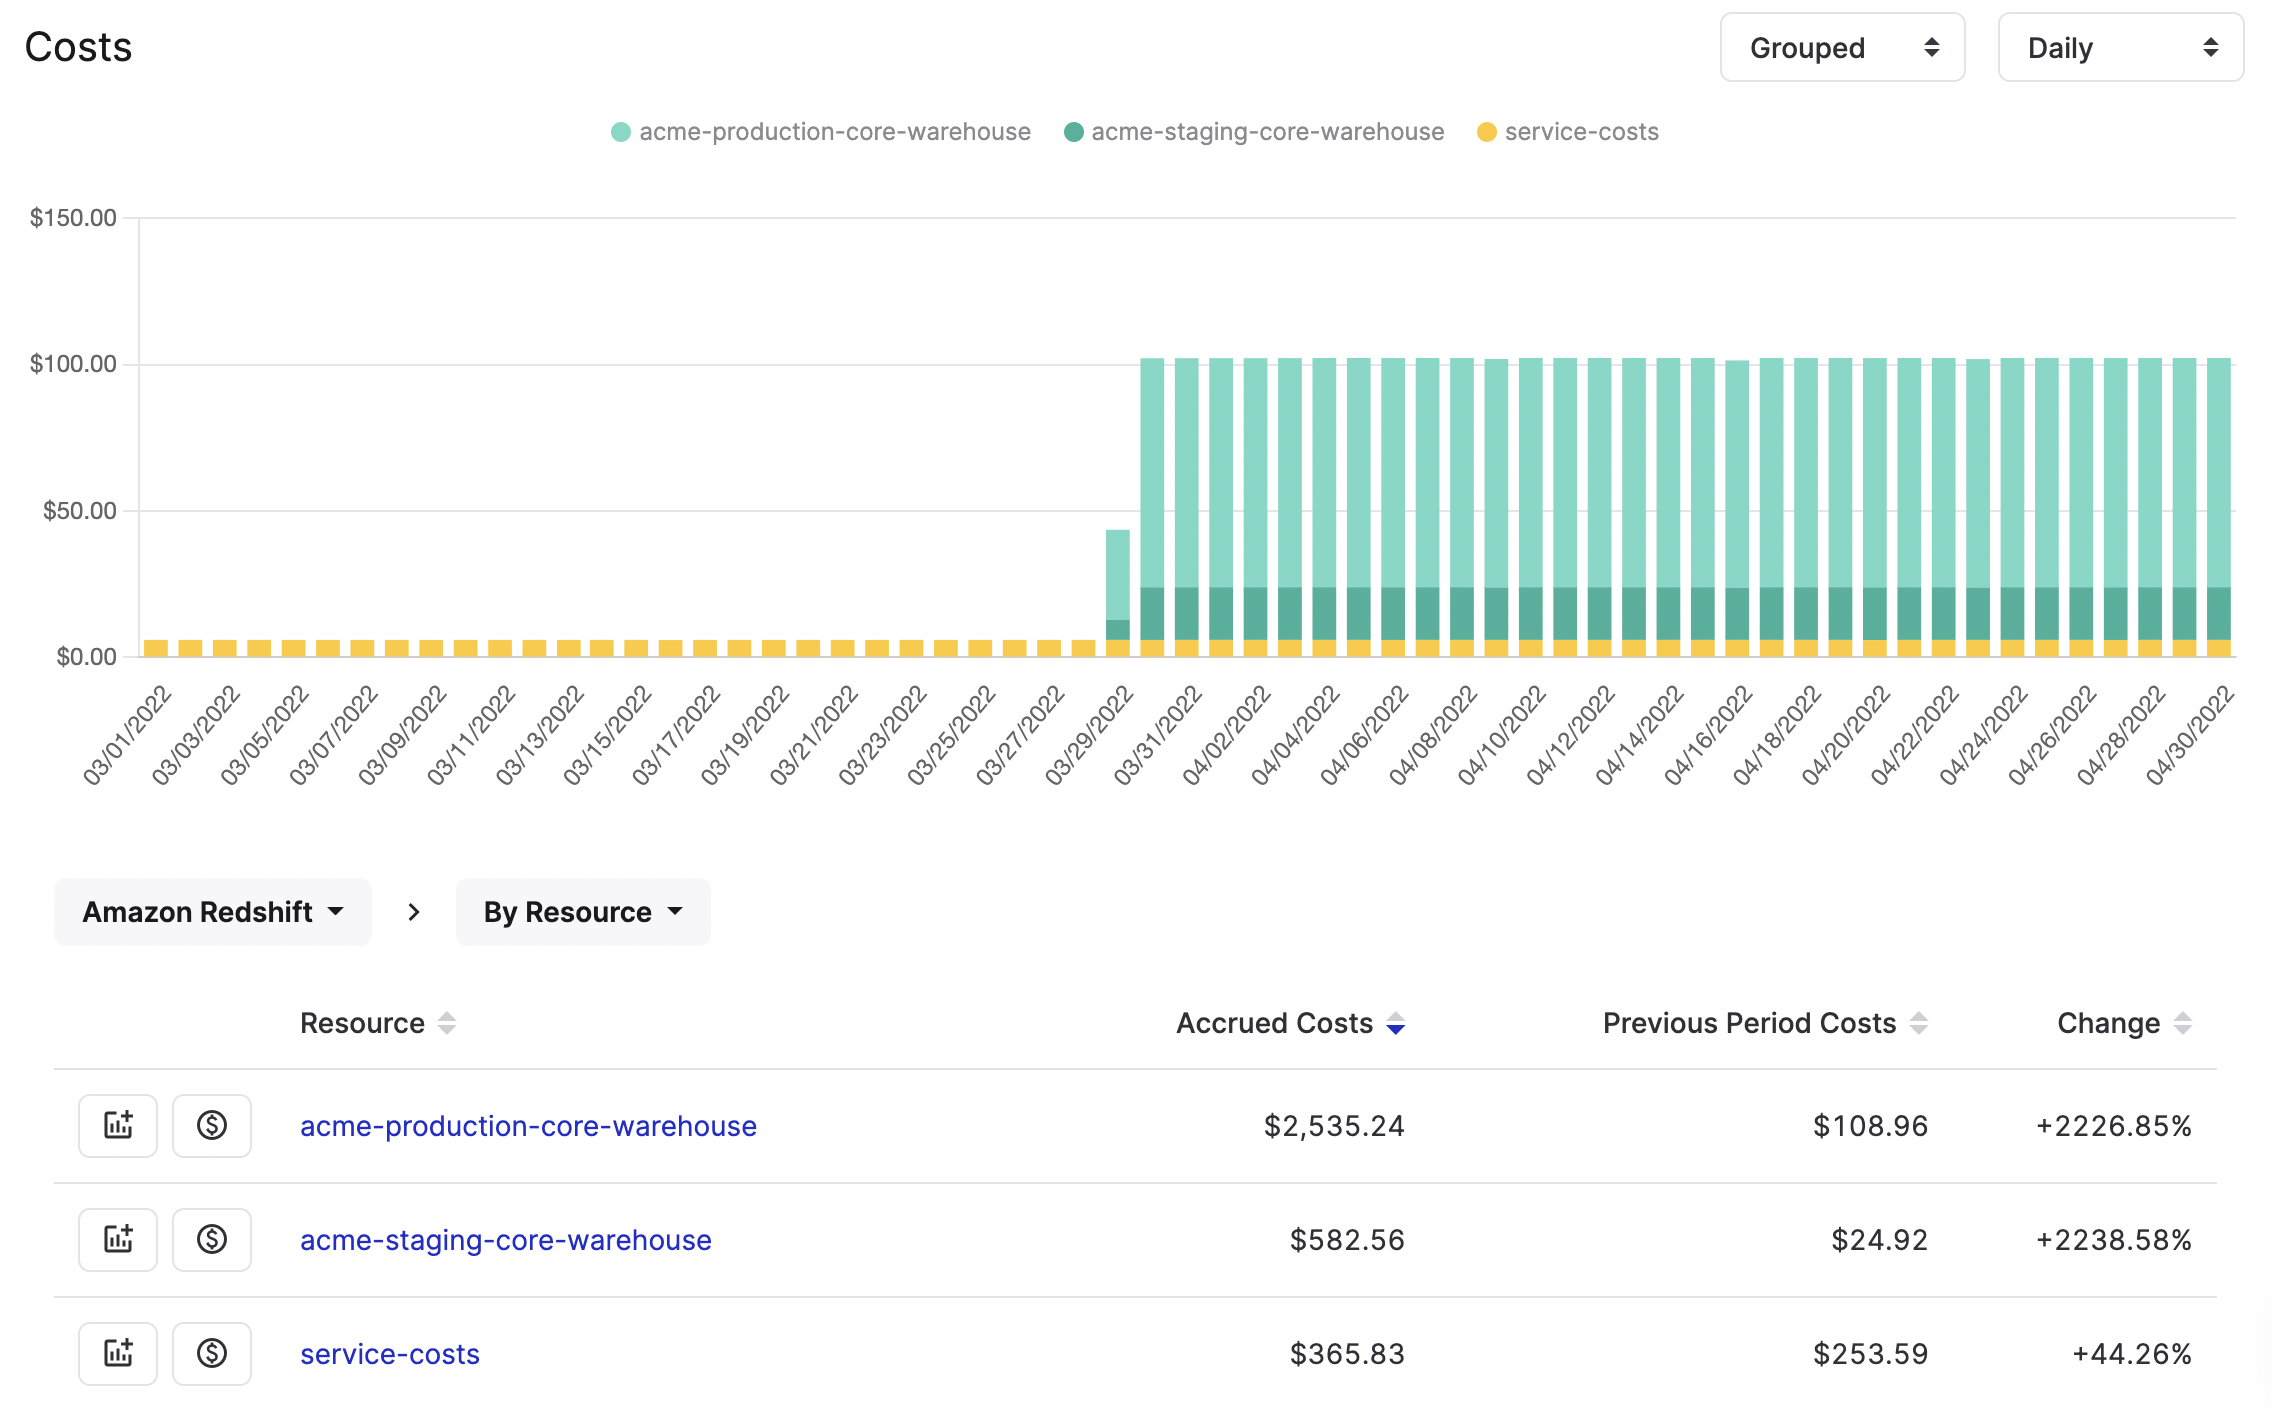
EC2 instances power multiple managed services inside AWS. To reveal these, save the Report first then click on the drill-down button on any row. In this example, we are inspecting Redshift instance costs.
Contribute
Contribute to this page on GitHub or join the #cloud-costs-handbook channel in the Vantage Community Slack.